|
Day Trading Scalping System - TradeStation Performance SummariesThis is the Day Trading Scalping System, codenamed Crawler, TradeStation 2000i Performance Summary page. Crawler TradeStation 2000i Performance Summaries are given for each year from 1997 to 2003. For a Day Trading Scalping System like this, with over 1,000 simulated trades per annum, I believe the Profit Factor is the best single number representing performance. The worse year was the year 2000 with a Profit Factor of only 1.14 (but still profitable). The worse drawdowns occured during the months of March and April 2000, which was the beginning of the DOTCOM implosion. Otherwise Crawler day trading system profit factors were quite acceptable for a scalper, ranging from 1.25 to 1.47. The round-trip commission was set at $5.00.
Click here Year 1997 Crawler Performance Summary - Note the S&P eMINI started trading on 11th September 1997 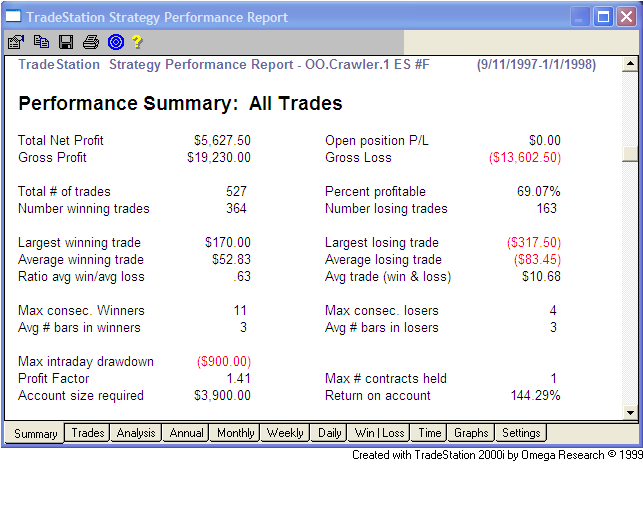
Year 1998 Crawler Performance Summary 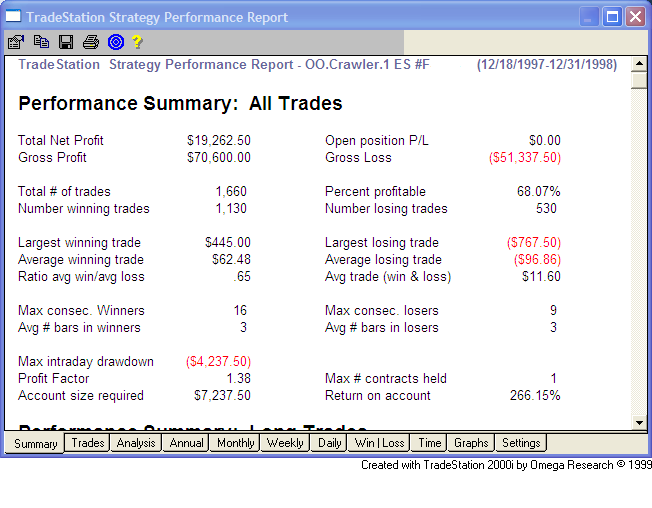
Year 1999 Crawler Performance Summary 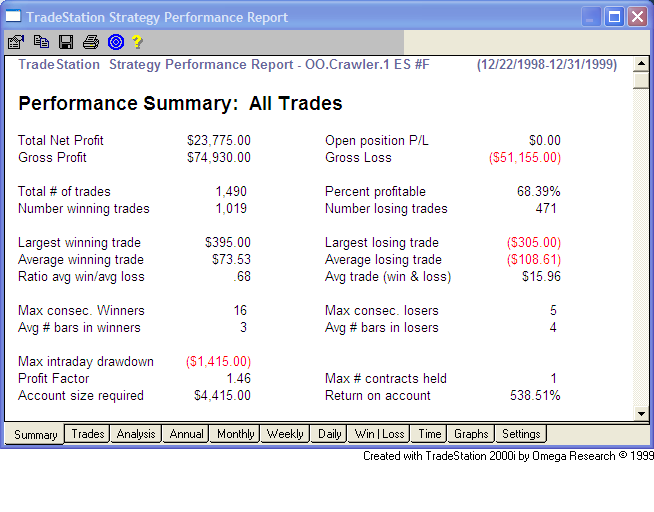
Year 2000 Crawler Performance Summary 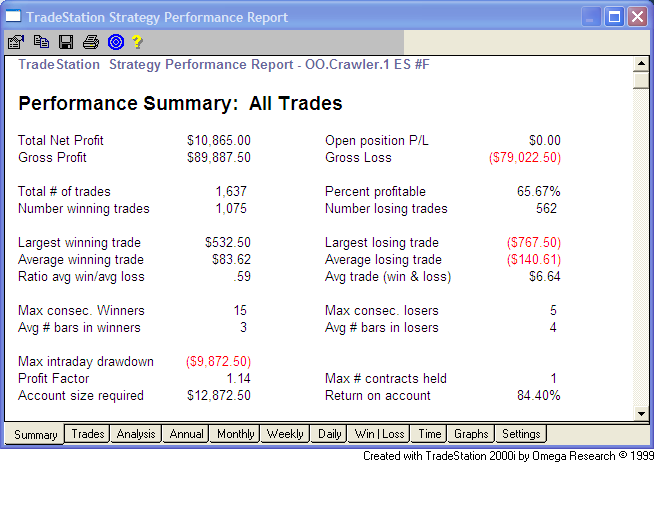
Year 2001 Crawler Performance Summary 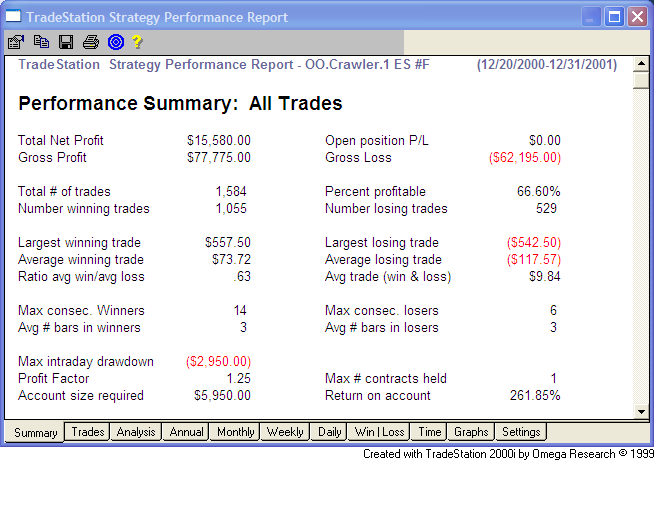
Year 2001 Crawler Performance Summary Year 2002 Crawler Performance Summary 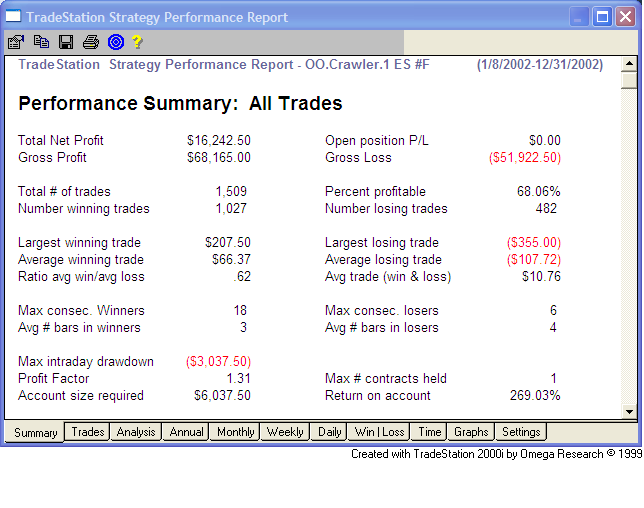
Year 2003 Crawler Performance Summary 
|